

Social Welfare Research
Explanation of source links:
Throughout the research below, you will find links of three types. The first and most frequent type is to primary sources such as governmental agencies. The second is to nonprofit groups that generally use government data or their own research to support their philanthropic mission. We have tried to use the least biased of these, or when in doubt, we have identified their bias. The third is to articles in periodicals or newspapers that we find to be of interest. These are not meant to be construed as original sources, and in some cases may not be accessible, depending on a reader's frequency of prior visits to the linked periodical or newspaper.
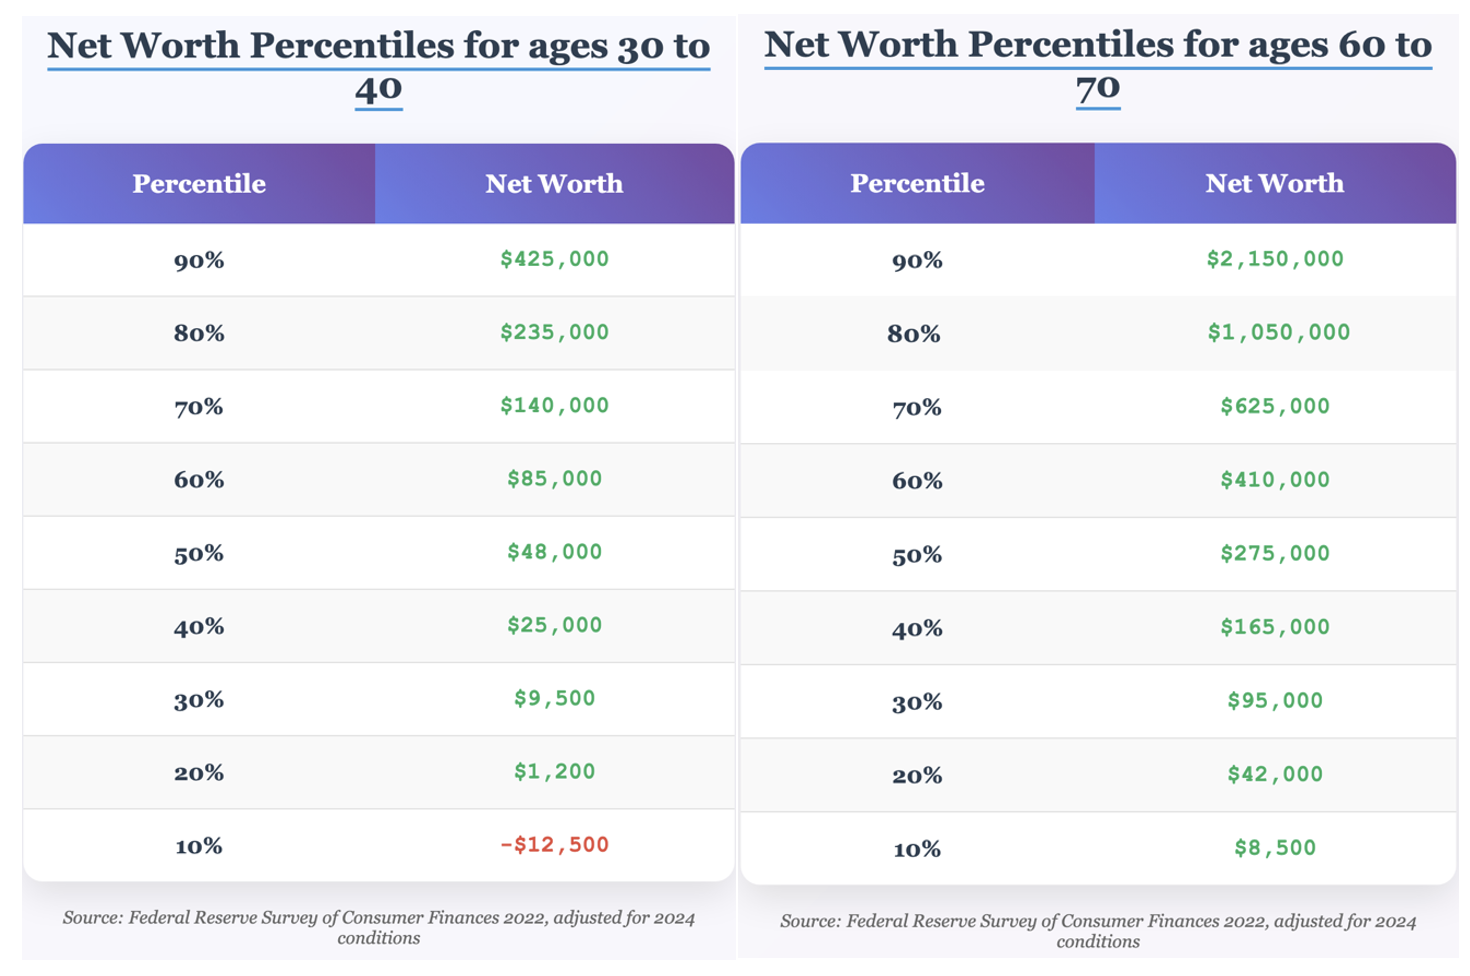
What does net worth look like in the US today?
Net worth in the US varies based on several factors, one of which is age. We have provided two snapshots of net worth by percentile of Americans between the ages of 30 and 40, the prime earning years, and ages 60 to 70, which is early retirement age. While net worth increases on average over this period, 50% of those between 30 and 40 have accumulated very little net worth at $48,000 or less. As for the early-retirement-age group, 50% have accumulated less than $275,000, which is insufficient to ensure a financially secure retirement.
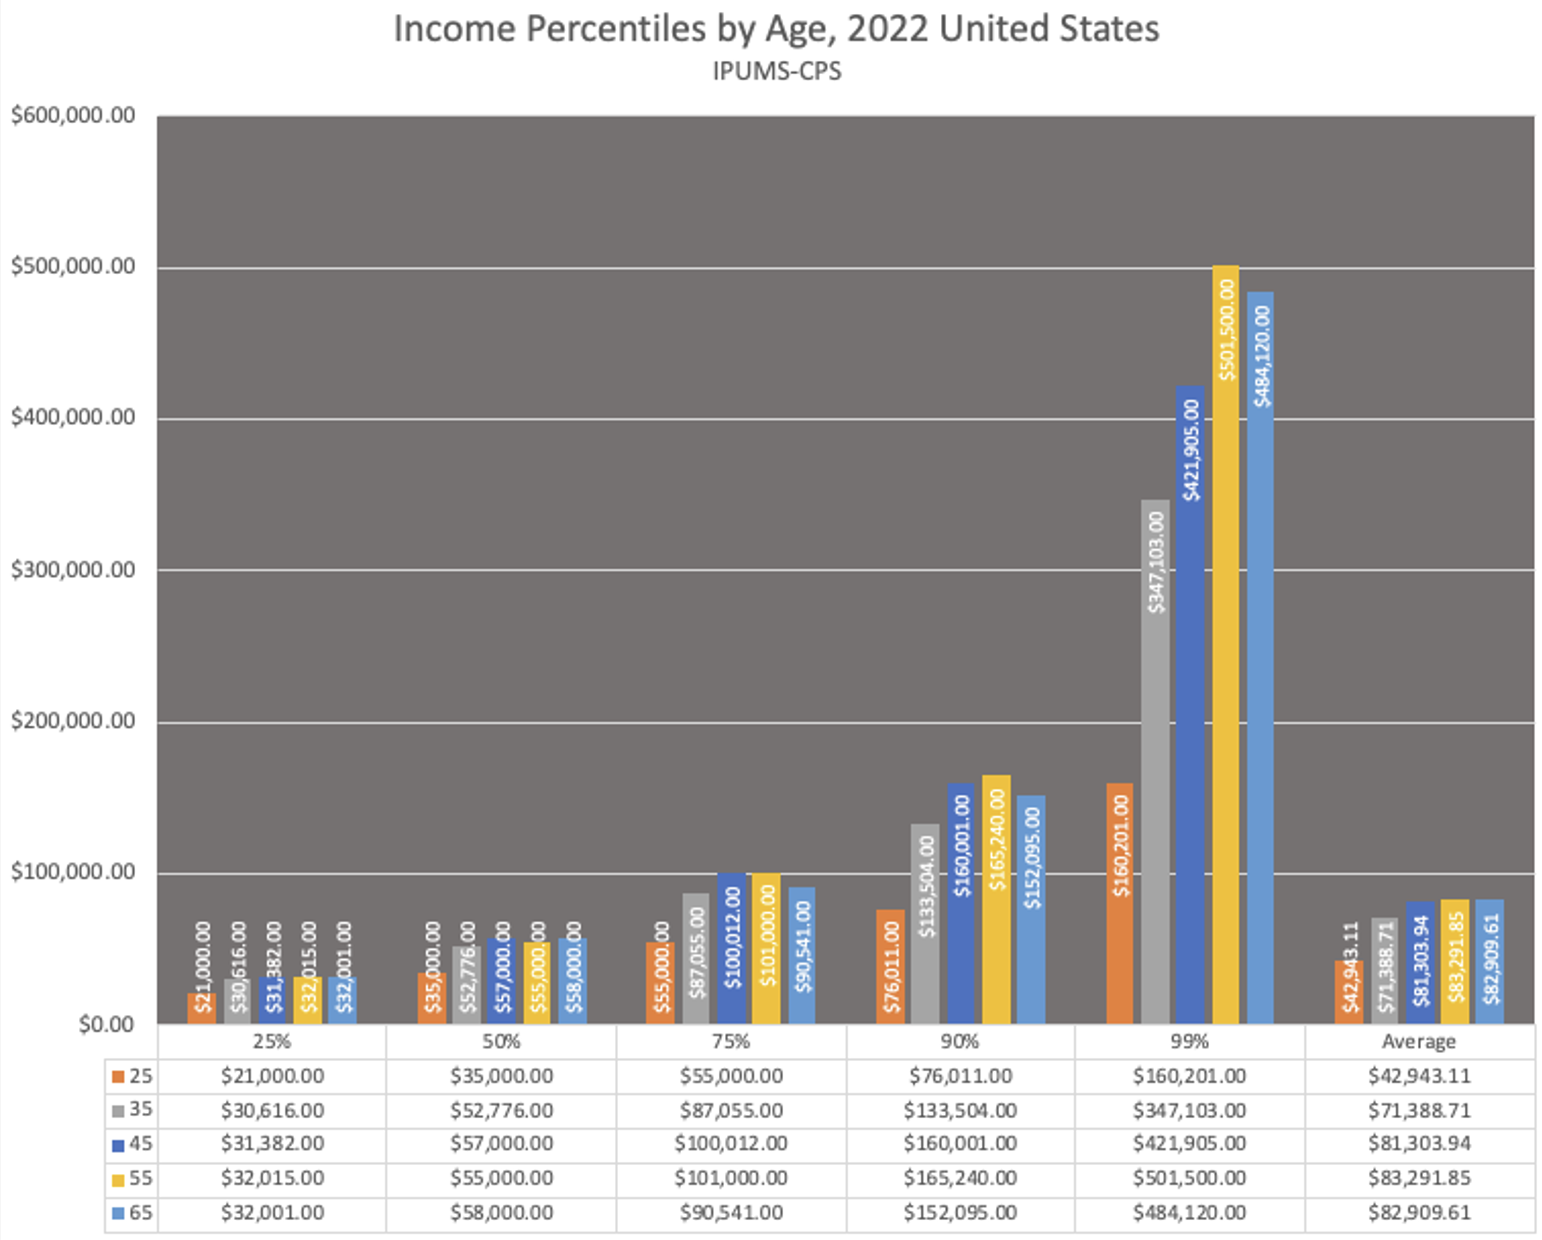
How much do Americans earn by percentile and at what age?
Again, as shown below in data from 2022, earnings initially increase with age and work experience until people are in their early to mid-40s, when earnings begin to level off. At this age, the average person in the US earns about $75,000 per year. Perhaps more meaningful, however, is the median, which is slightly less than $55,000 per year.
What is the definition of poverty in the US?
The federal government defines poverty thresholds based on various family configurations. For example, a one-person household would fall below the federal poverty definition with an annual income of $15,060 or less, while a family of four having an income of $30,000 or less per year would be defined as living in poverty.
For a fuller explanation, the Institute for Research on Poverty is a useful resource.
How many people in the US fall below this level of income?
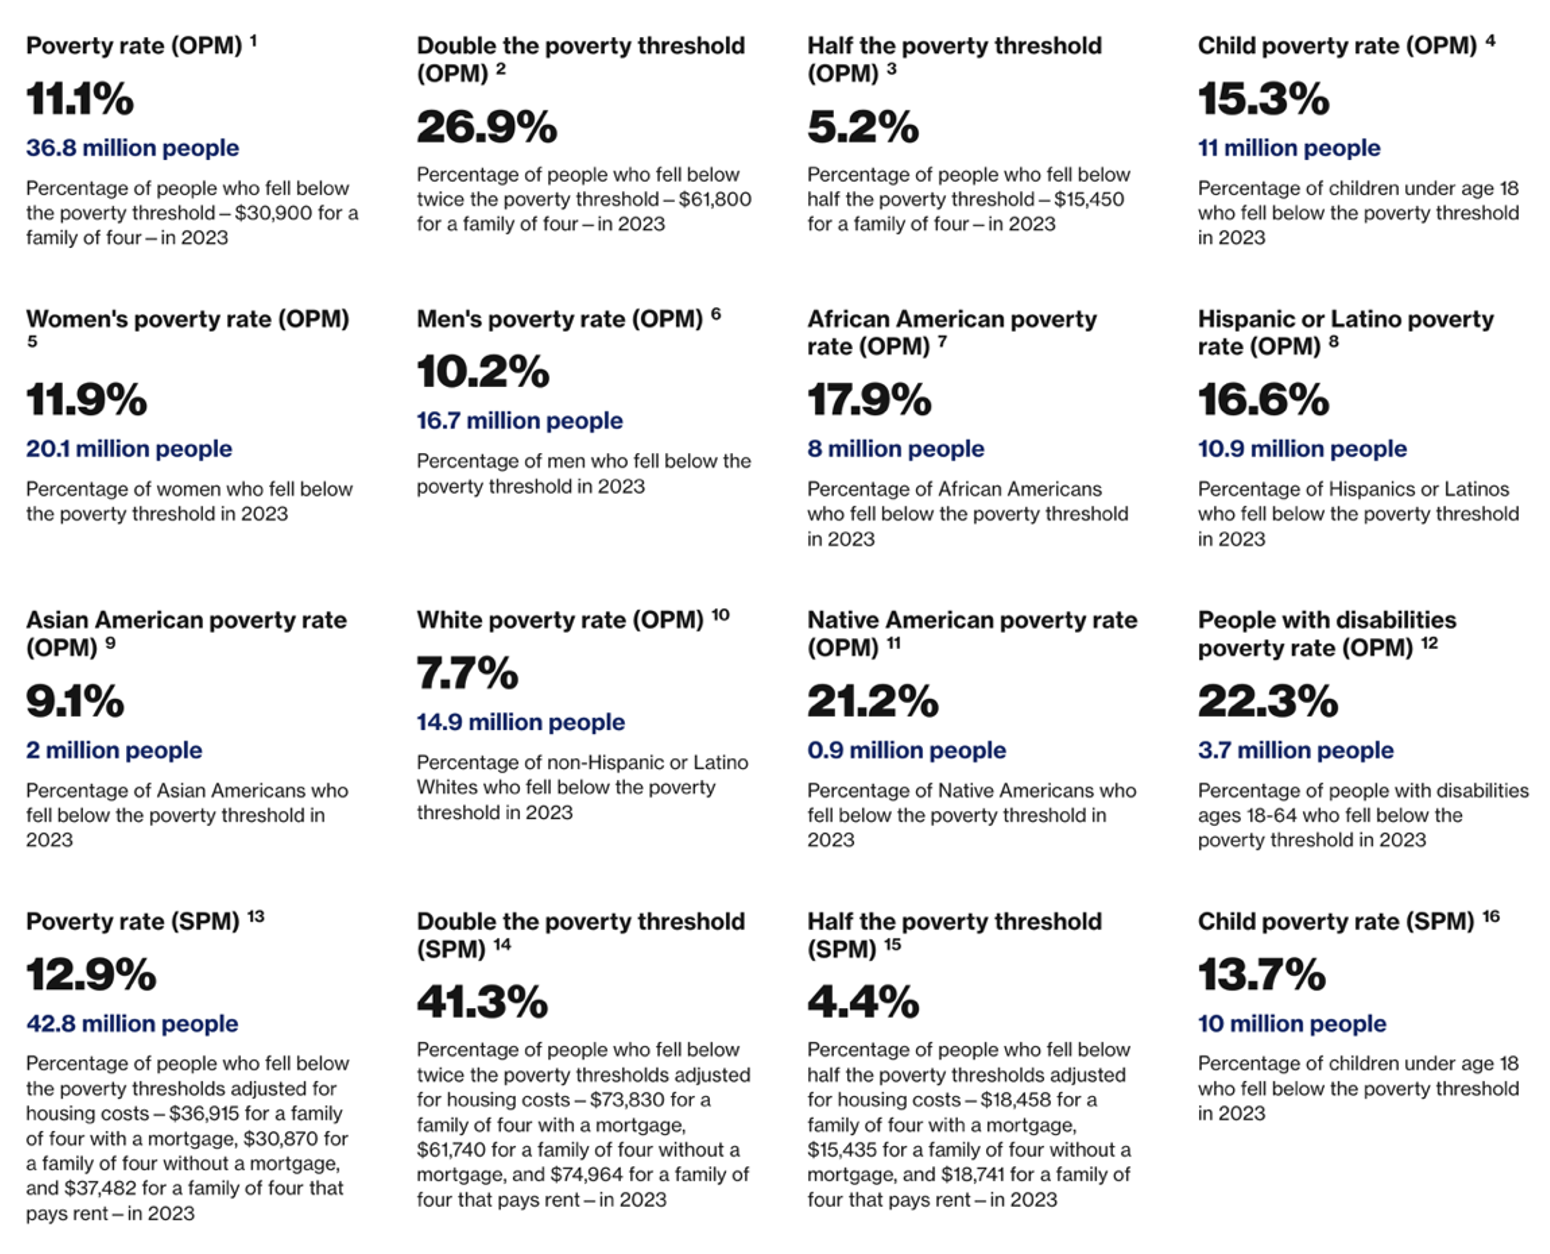
In 2023, when the most recent census data were aggregated, 11.1% of the US population were living in poverty, which equates to approximately 36.8 million people.
What is the general profile of Americans living in poverty?
According to the US Census Bureau and the Center for American Progress, in 2023:
7.7% of White Americans, 17.9% of Black Americans, 9.1% of Asian Americans, and 16.6% of Hispanic Americans lived in poverty.
Geographically, the rates of poverty were 9.8% in the Northeast, 9.8% in the Midwest, 12.4% in the South, and 11% in the West.
The incidence of poverty was distributed more or less evenly between metropolitan and non-metropolitan areas.
22.3% of Americans with disabilities lived in poverty, as did nearly 6% of veterans.
Below is a snapshot of US poverty data in 2023, provided by the Center for American Progress.
How many Americans are homeless?
According to the Department of Housing and Urban Development, in 2023, an estimated 653,100 people in the US experienced homelessness on at least one night of the year.
How many Americans are “hungry”?
The Department of Agriculture defines hunger in the US by referencing the concept of “food insecurity.” Food insecurity means that one lacks consistent access to enough food for an active, healthy life. A total of 47.4 million Americans were estimated to suffer from this condition as of 2023.
Counterintuitively, food insecurity has increased even as strictly defined poverty has declined. The official definition of poverty counts people under an income line, while food insecurity captures the real-world strain of affording food. When food prices rise faster than incomes or when supports are cut back, food insecurity can increase even as official poverty declines.
What does preparation for retirement look like?
As indicated above, 50% of Americans on the cusp of retirement age have $275,000 or less of net worth. Since net worth includes a person’s home, cash available for retirement would be considerably less. According to FederalReserve.gov, in 2022, pre-retirement households headed by someone aged 56 to 61 had a median balance of $185,000 in traditional retirement accounts such as 401ks, IRAs, etc.
Another indicator of preparation for retirement is the number of retired Americans who depend on Social Security for a substantial amount of their cash flow. In January 2025, the average retiree received taxable Social Security benefits of $1,976 a month. Disabled retirees received an average of $1,537 a month. According to the Social Security Administration, 37% of retired men and 42% of retired women receive at least 50% of their income from Social Security, while 12% of men and 15% of women receive at least 90% of their income from Social Security.
According to the Federal Reserve, a net worth of $13.6 million puts one in the top 1% of Americans, with the average person in the 1% category having a net worth of over $33 million. This amounts to 30.9% of the country’s wealth, which is more than the entire 90% of lower-net-worth Americans combined. This gap has continued to widen over the past 50 years, and is now reaching a record level. (A useful summary of this was recently provided in an article by the Washington Post.)
Are there any indications that wealth in the us has become increasingly concentrated at the top? What is the status of the “american dream”, upward mobility, and kids doing better than their parents?
Yes, there are several observations that can be made, all of which have only become more pressing over the past decade.
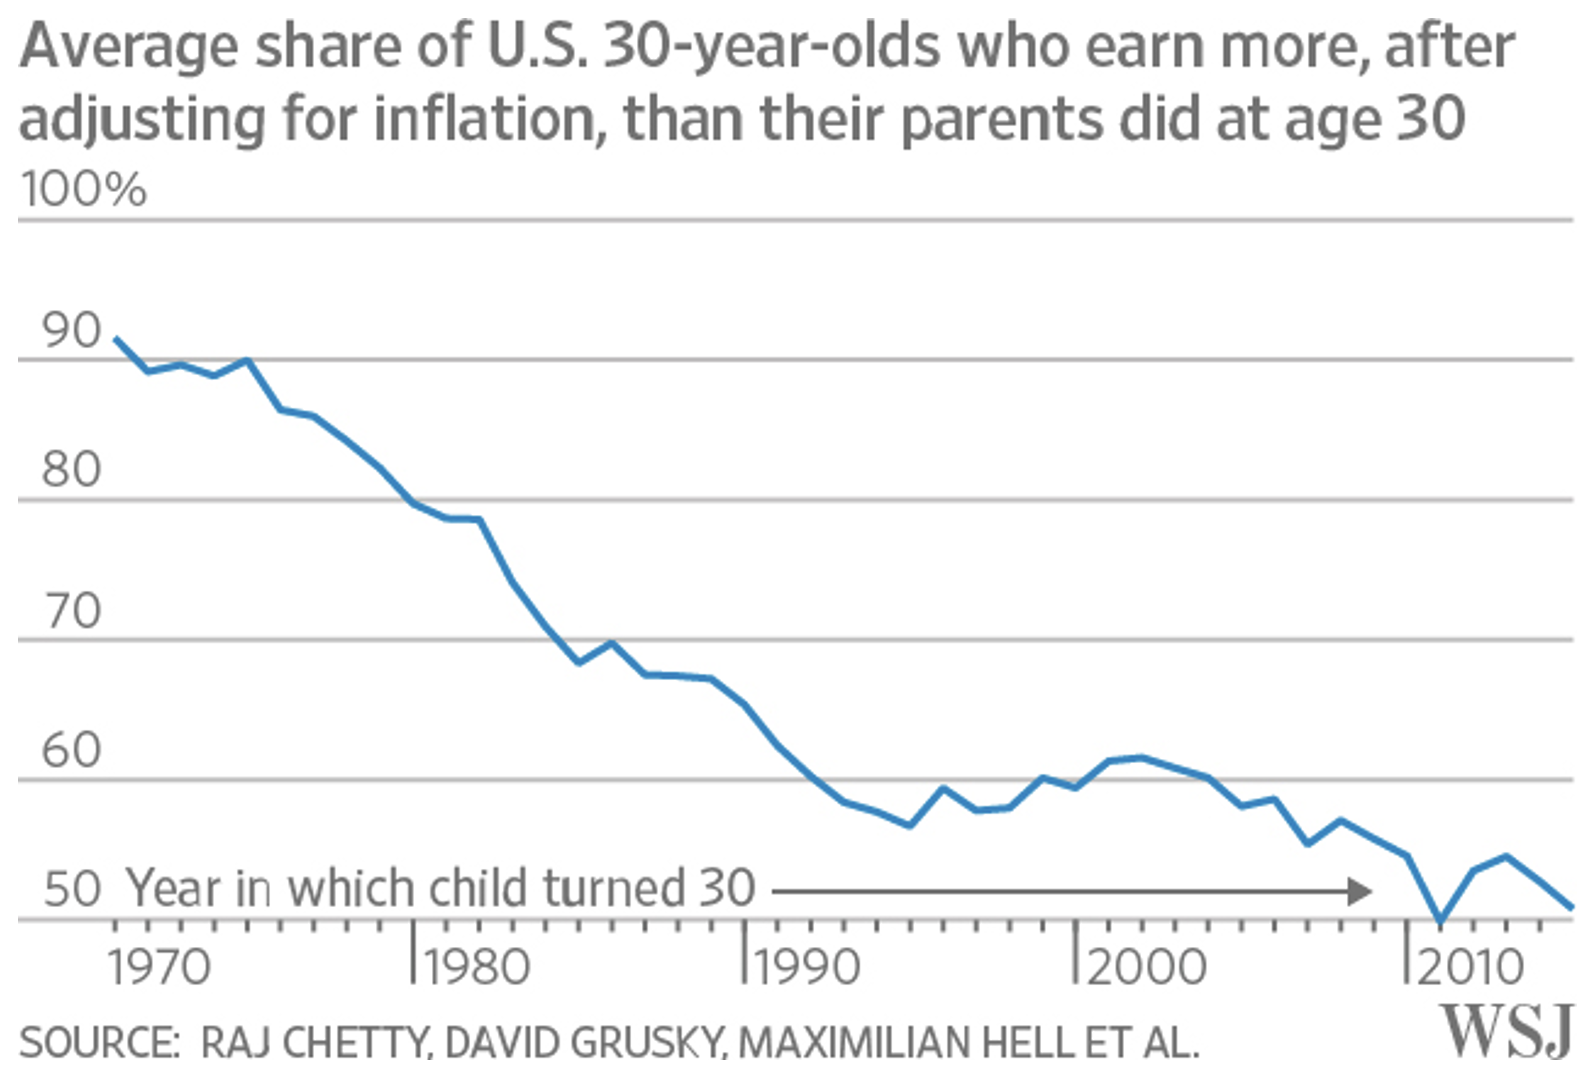
In 2018, Richard Reeves and Eleanor Krause of Brookings summarized several indications based on the research of Raj Chetty, Professor of Economics at Harvard University. The article is entitled “Raj Chetty In 14 Charts: Big Findings on Opportunity and Mobility We Should All Know.”
The first indicator Chetty outlined was a decline in the percentage of children who do better over time than their parents.
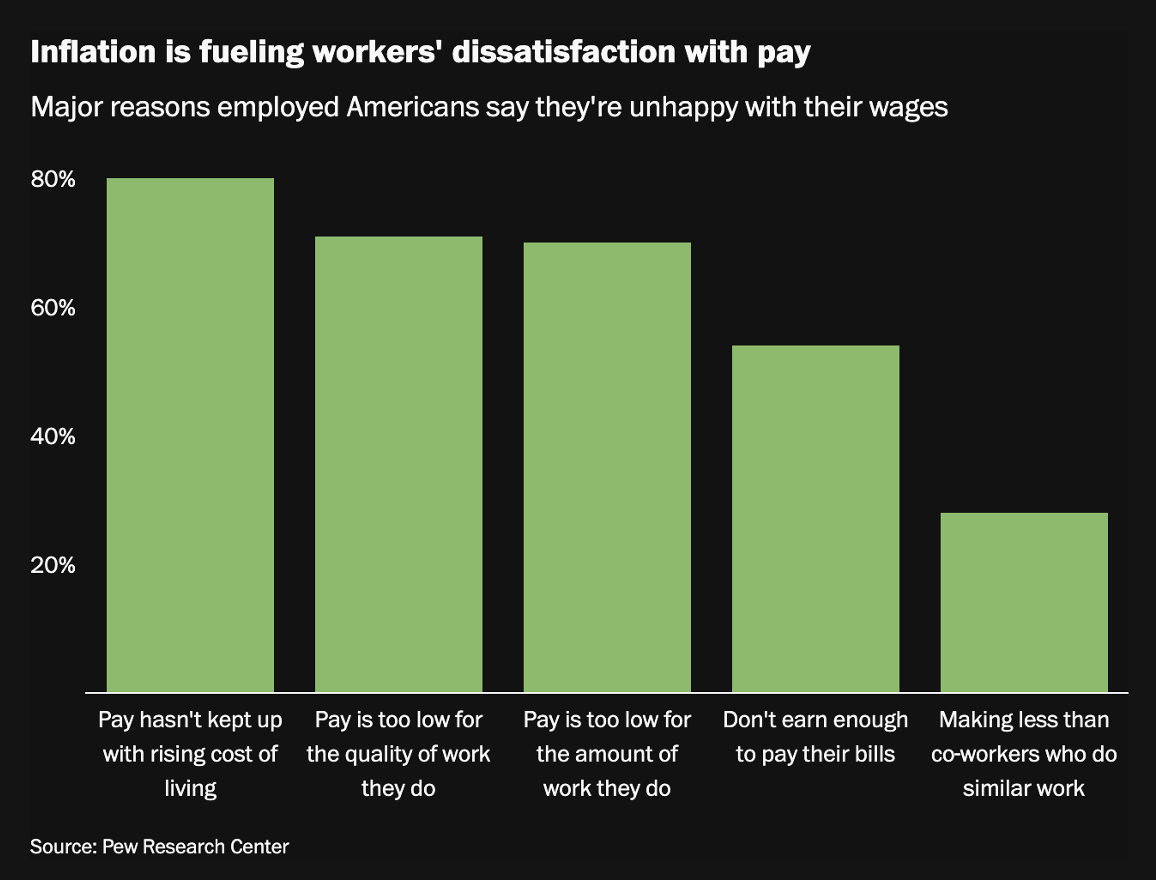
A second indicator is wage growth in relation to inflation and cost of living. The Washington Post wrote, based on a 2024 report by the Pew Research Center, “Only 30 percent of Americans are satisfied with their pay, compared with 34 percent last year … reflecting the ongoing burden of recent price increases. Most workers who voiced frustration about their pay—80 percent—said it was because their wages hadn’t kept up with the higher costs of living, and more than half said they didn’t earn enough to pay their bills.”
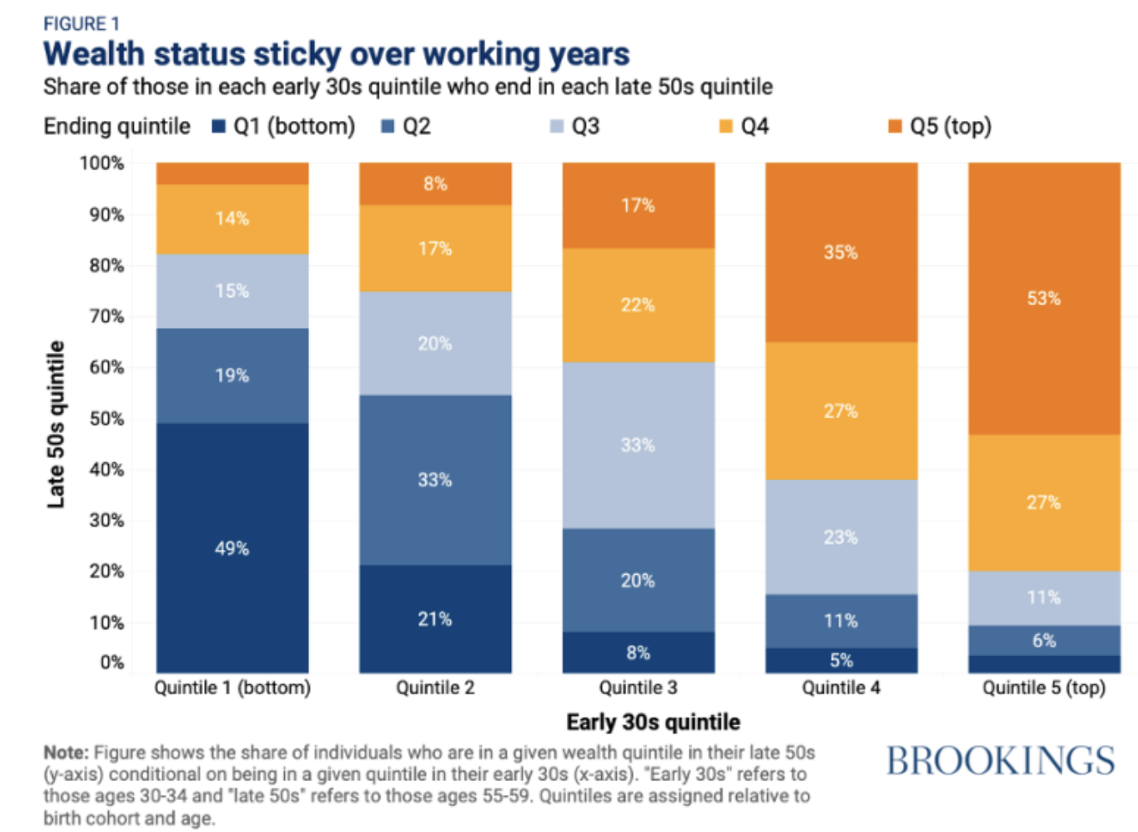
A third indicator is the upward or downward mobility of people born into each of the five quintiles of wealth. According to a Brookings study from 2022: “Wealth position is most rigid among those with the least and most wealth; half (49 percent) of those in the bottom wealth quintile in their early thirties are still there in their late fifties. At the other end of the ladder, half (53 percent) of those who start in the top quintile stay there.”
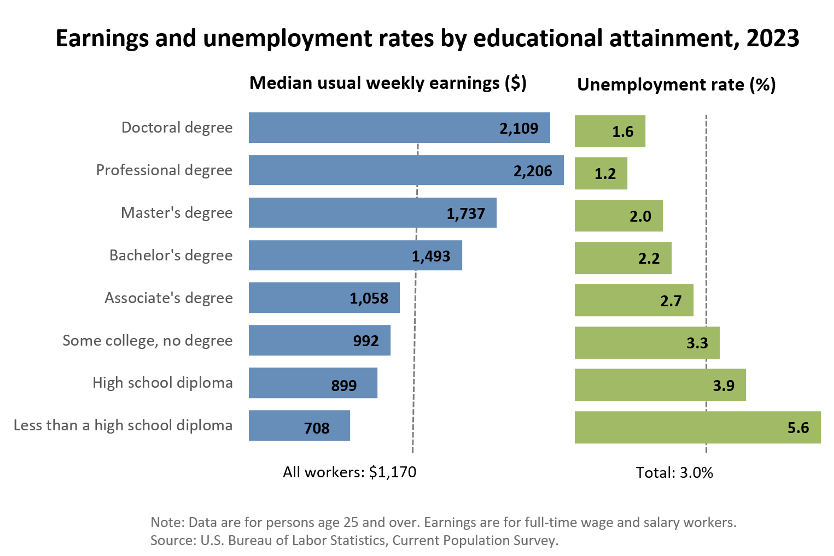
Indicator number four, education, is highly correlated to future earnings and wealth creation, as demonstrated by the following chart provided by the Bureau of Labor Statistics.
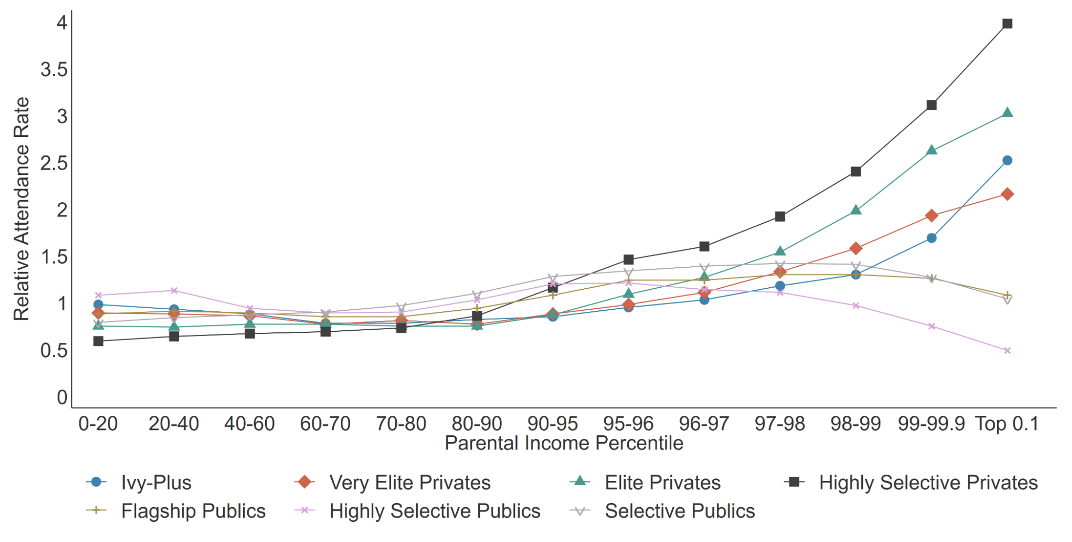
The ability to obtain a college education is highly correlated with beginning wealth, as demonstrated by the following chart from Ithaka S+R, which shows how likely someone is to attend various tiers of academic institutions based on the income of their parents. In the most extreme case, we see that the top 0.1 percentile earners are four times more likely to send their children to highly selective private schools. On the whole, the limiting factors of educational availability and circumstances of one’s birth are having a negative effect on Americans’ ability to achieve the “American Dream”. Without being born into a wealthy household, you are significantly less upwardly mobile than you were a few decades ago.
How has median net worth changed over the past 10 years?
Over the past decade, U.S. household net worth has more than doubled, rising from a record $86.8 trillion in the fourth quarter of 2015 to approximately $176 trillion by the second quarter of 2025, reflecting robust growth driven by surging asset prices in equities, real estate, and other investments amid economic expansion and low interest rates. This aggregate increase, however, masks uneven distribution, with the average household net worth climbing from about $700,000 in 2015 to $1.17 million in 2025, skewed by gains among higher-wealth groups, while median net worth grew more modestly by 61% from $120,000 in 2016 to $193,000 in 2022, indicating broader but disparate participation in wealth accumulation. Despite temporary setbacks, such as a decline to $169.3 trillion in the first quarter of 2025 due to market fluctuations, overall net worth has shown resilience, rebounding strongly in subsequent periods and reaching new highs by mid-2025.
What is the impact of home ownership?
The primary residence continues to be the largest asset category, accounting for 26.9% of household assets. In monetary terms, as of 2022, homeowners collectively held about $40.9 trillionworth of owner-occupied real estate—surpassing corporate equities and mutual fund shares (24.4%, $40.7 trillion), pension and retirement entitlements (18.3%, $30.6 trillion),and other financial and nonfinancial assets taken together (30.4%, $50.7 trillion).
What are the various social welfare programs, ranked by size, in the US today?
The federal government provides welfare in three fundamental ways. The first is through programs like Social Security and Medicare, in which Americans pay specific taxes designed to fund them. The second is through programs funded by general tax revenues, such as Medicaid. The third is through tax deductions designed to subsidize and encourage behavior, such as home ownership and retirement savings. These programs are referred to as “tax expenditures.”Each of these programs is described below.
Social Security—$955 billion:
Overview: The largest of all social welfare programs is Social Security, which is estimated to provide $1.6 trillion in benefits in 2025, with an average of 69 million Americans receiving benefits each month. Retired workers and their dependents account for 78% of total benefits paid (about $1.125 trillion), disabled workers and their dependents account for 10% of total benefits paid (about $153 billion), and survivors of deceased workers account for 12%.
Background: The Social Security Program was formed pursuant to the Social Security Act of 1935. At the outset, it was thought of as “old age” insurance, until a 1939 amendment added child, spouse, and survivor benefits. The original act provided for monthly retirement benefits, payable to persons 65 and older who were no longer working. The benefit formula was based on cumulative wages (earned since 1937) in covered employment (initially covering only about half the jobs in the country, which were in commerce or industry). Specifically, monthly benefits equaled 1/2 of 1% of the first $3,000 of cumulative wages, plus 1/12 of 1% of the next $42,000, plus 1/24 of 1% of the next $84,000. So, for example, someone who retired in January 1942 (when benefits were scheduled to begin) after earning a total of $6,000 during the five-year period from 1937 to 1941 would receive a benefit equal to $17.50 a month. This can be thought of, loosely speaking, as a typical benefit because the average worker at the time earned about $100 a month (which totals $6,000 after five years). Under the 1935 Act, retirement benefits were to be paid only if the individual was no longer engaged in regular employment. The 1939 amendments created the retirement earnings test. Under this standard, earnings of more than $15 a month precluded payment of benefits.
Also under the 1935 Act, benefits were to be based on payroll tax contributions that the worker made during his/her working life. A five-year gap between when these contributions started being taken and when they became available made this possible. It was not until the 1950s that this shifted to become a universal program, with contributions being paid into a pool that could be accessed regardless of how much the worker paid into the system.
The amendments of 1939 also led to the creation of dependent and survivor benefits. A wife of a retired worker was eligible for a 50% benefit, provided she was at least 65. Aged widows (and those caring for dependent children) were eligible for benefits paid at a 75% rate. Dependent children of retired or deceased workers received a 50% benefit. In 1957, the Disability Insurance Program was enacted. Initially, to hold down costs, disabled-worker benefits were limited to persons between the ages of 50 and 64 and were received by a relatively small number of persons (around 330,000 in 1959). Today, disabled workers can be of any age (under the full retirement age), and they number more than 5.5 million.
What percentage of retiree income does Social Security represent? Social Security benefits represent about 31% of the income of people over age 65. Among Social Security beneficiaries age 65 and older, 39% of men and 44% of women receive 50% or more of their income from Social Security. The average retiree receives an average of $1,783.55 a month, whereas disabled workers receive an average of $1,539.92 a month.
How is Social Security paid for? Workers and employers pay for Social Security. Workers pay 6.2% of their earnings up to a cap, which was $176,100 in 2025. Employers make a payment equal to their employees’ payments.
Does it benefit the wealthy? Yes. Social Security is not means tested and is available to anyone who has contributed, or is the spouse of a contributor, based on his or her lifetime earned income. Given that, it follows that the wealthy benefit as do the non-wealthy. In recent estimates, about one in six retirees in the US is a millionaire, amounting to 7.2 million retirees. The highest possible monthly Social Security benefit for a retiree in 2023 was $3,627. If each of these millionaires received the maximum annual Social Security benefit, it would total $31,536 per person, translating to approximately $226.2 billion per year in total payments to this group of wealthy retirees.
Medicare—$672 billion:
Medicare is a federal program that provides health coverage if you are 65 or older or have a severe disability, regardless of your income. 67.5 million people currently receive Medicare, a number that approximates the population in America over the age of 65.
Background: Like Medicaid, Medicare was created in 1965 during the administration of Lyndon B. Johnson. Medicare originally included only hospital and medical insurance. In 1972, these benefits were expanded to cover people with disabilities, people with end-stage renal disease requiring dialysis or kidney transplant, and people 65 or older that select Medicare coverage. Individuals under 65 with a disability who receive Social Security cash payments can also receive Medicare. Medicare also now covers prescription drugs.
How is it funded? Medicare is funded in several ways: general revenue (43%), a payroll tax of 1.45% of all employee earnings that is matched by an equal employer contribution (36%), premiums from participants (13%), and various state payments and miscellaneous sources.
Does it benefit the wealthy? Yes. Like Social Security, Medicare is not means tested and is available to anyone over the age of 65, meaning that Medicare benefits the wealthy and the non-wealthy. Following the same method used for Social Security, if the average American with net worth above $1 million receives an average benefit of $15,300 per year, total payments to them would approximate $110 billion.
Medicaid—$566 billion:
Medicaid is a program funded and administered through federal and state partnerships that provides health insurance to low-income Americans. It was started by President Lyndon B. Johnson in 1965.
Who qualifies for Medicaid? Since the states administer and contribute to Medicaid, eligibility and benefits vary by state. For non-disabled, non-pregnant adults, most states set the income limit between 106% and 138% of the federal poverty level, which translated to $14,580– $19,392 annually for a single individual in 2023. In 2024, 88.8 million Americans received Medicaid.
How is it funded? Medicaid is funded by the general income tax.
Does it benefit the wealthy? No.
Health Benefit Tax Expenditure—$616 billion:
The government subsidizes the employer-provided health care of Americans. Although most forms of compensation are taxable, the provision of health care insurance is not. This constitutes a benefit to Americans with W2 income and employer-provided health care.
What is the cost? This benefit is not a direct outlay, but rather an estimated cost to the US government of forgone revenue. The US Treasury estimated that this benefit cost $325 billion in 2023.
Does it benefit the wealthy? Yes. This program benefits employed Americans with W2 income, regardless of net worth or income. It does not benefit the unemployed, retired people short of Medicare eligibility, students, independent contractors, or employees of small companies that do not provide health care as a benefit.
Savings Tax Expenditure—$230 billion:
The US government subsidizes the savings of employed Americans through tax expenditures. Based on the most recent data available as of September 2025, the estimated savings tax expenditure for 2025 is approximately $250 billion. This includes the deductibility of employer and employee contributions to defined benefit plans ($85 billion), defined contribution plans such as 401(k)s ($60 billion), IRAs ($55 billion), and self-employed savings programs ($30 billion). Such contributions are also tax-free to the employee.
What is the cost? Like the mortgage deduction, the annual cost to the US of this policy is not measured as a direct expenditure, but rather is an estimated amount of forgone tax revenue.
Does it benefit the wealthy? Yes. According to the PSCA, as of March 2025, 91.1 % of households with income of $150,000 or more had savings in DC accounts or IRAs, while just 13.2 % of households with income of less than $30,000 did.
Home Ownership Tax Expenditure—$121 billion:
For many decades, it has been the policy of the US to encourage home ownership. This is done in three ways. First, the government supports the principal mortgage lenders, Fannie Mae and Freddie Mac. This support results in below-market interest rates for mortgages. Secondly, the government allows a tax exclusion on the sale of homes of $250,000 per individual and $500,000 per married couples. And thirdly, the government allows for the deduction of interest expense on first and second home mortgages up to $750,000 each (grandfathered up to $1,000,000 for mortgages existing before the tax reform of 2017).
How much do these subsidies cost? The cost of supporting Fannie and Freddie is not easy to estimate, and we will ignore this subsidy for now. The costs of the two tax deductions, however, are directly quantifiable from IRS data. In 2024, the Joint Committee on Taxation estimated that after the expiration of temporary Tax Cuts and Jobs Act provisions, the mortgage interest deduction would reduce revenues by $81.3 billion in FY2026 and $100.6 billion in FY2027. The capital gain exclusion is estimated to cost the US Treasury an additional $46.4 billion, as of 2023.
Does it benefit the wealthy? Yes. As discussed above, home ownership is most common among higher-net-worth Americans, and large mortgages, mortgages on second homes, and the related interest deductions are exclusively incurred and claimed by high-net-worth Americans. Again, according to the Joint Committee on Taxation, households with incomes greater than $100,000 received 81% of the mortgage interest deduction benefit in 2022.
Supplemental Nutrition Assistance Program (SNAP)—$80 billion:
SNAP was previously known as the food stamp program and is often still referred to in that way. It provides a benefit card that participants can use to buy certain foods at grocery stores. In 2023, SNAP served an average of 42.1 million participants per month. Federal SNAP spending totaled $112.8 billion and benefits averaged $211.93 per participant per month. The share of US residents who received SNAP benefits in 2023 was 12.6 percent.
How is it funded? SNAP benefits are funded through federal taxes. The administrative costs are split 50-50 between federal and state taxes.
What is the history of SNAP?In 1961, President John F. Kennedy used his first executive order to initiate the food stamp pilot program. In 1964, Lyndon Johnson signed the Food Stamp Act, making the program a permanent fixture. By 1974, the program had been expanded to all 50 states and territories. In 1984, the Electronic Benefits Transfer program began, which allowed food stamp beneficiaries to use food stamps through an EBT card. By 2004, EBT use was nationwide.
Who qualifies for SNAP? To qualify for SNAP, your total household income cannot be more than 130% of the federal poverty level. For 2025, this meant that a single person’s monthly income could not exceed $1,632. Furthermore, a household receiving SNAP cannot have financial holdings of over $3,000. If at least one person in the household is over the age of 60 or is disabled, the household may have $4,500 in financial assets.
There is also an employment requirement for SNAP. While you don’t have to be employed, you can lose your benefits if you intentionally lose your job or decrease your hours. Also, you must be registered to work, and must take a job if it is offered. “Able bodied adults without dependents are required to work or participate in a work program for at least 20 hours per week in order to receive SNAP benefits for more than 3 months in a 36-month period.”
Does it benefit the wealthy? No.
Earned Income Tax Credit (EITC)—$65 billion:
The Economic Policy Institute provides some history of this program, which consists of a tax credit for low- to moderate-income workers and families. Eligibility for the credit is determined through a combination of need and household size, ranging from single persons with no income to larger families. In 2025, a married couple with three or more children may earn up to $68,675 a year and still qualify. The EITC was part of the Tax Reduction Act of 1975, which was passed into law during the Ford administration. Originally, the EITC was supposed to be a temporary refundable tax credit for lower-income workers to offset the Social Security payroll tax and rising food and energy prices. The credit was made permanent by the Revenue Act of 1978. The EITC was considered both an anti-poverty program and an alternative to welfare because it created an incentive to work.
The Reagan administration substantially expanded the program with the Tax Reform Act of 1986. Reagan called it “the best anti-poverty, the best pro-family, the best job creation measure to come out of Congress.” Since 1978, Congress has enacted several smaller changes, with the maximum credit for a worker with three children increasing from $400 in 1978 (about $2,000 in 2025 dollars) to $8,046 in 2025.
How many people participate? As of December 2023, about 23 million workers and families received some sort of tax relief from the EITC. Because of the credit, an estimated 45% of taxpayers paid no income tax.
Who is eligible to participate? To qualify for and claim the Earned Income Tax Credit in 2025, you must have earned income; have been a US citizen or resident alien for the entire tax year; not have investment income exceeding $11,950; and both your earned income and Adjusted Gross Income (AGI) may not exceed $19,104 per year for a single person with no children or up to $68,675 for a married couple with three children.
Does it benefit the wealthy? No.
Supplemental Security Income Program (SSI)—$57 billion:
SSI provides monthly payments to help the aged, blind, and disabled buy food, clothing, and shelter. SSI originated as part of the Social Security Act of 1935. In 1972, President Nixon modernized the program. Under the new arrangement, SSI would provide “a uniform Federal income floor while optional State programs supplemented that floor.” This means that each state created a basic level of assistance that they were willing to give to those receiving SSI, and then the federal government gave enough funds for all states to meet federal standards.
Who is eligible? To qualify for SSI, you must be age 65 or older, be totally or partially blind, or have a medical condition that keeps you from working and is expected to last at least one year or result in death. SSI eligibility is derived by taking “countable income” (wages, other benefits) and subtracting it from the amount of SSI benefits available in your state. In 2025, individuals can earn up to $2,020 per month and couples can earn up to $2,985 per month. Also, you cannot receive SSI if you have assets worth more than $2,000 for an individual or $3,000 for couples. In 2023, 85% of recipients were either blind or disabled.
Does it benefit the wealthy? No.
Municipal Bond Interest Tax Expenditure—$43 billion est. (over 10 years):
The IRS does not tax “tax-exempt” municipal bonds. The cost of this exemption is estimated by the CBO to be $43 billion over the period 2025-2034.
Does it benefit the wealthy? The benefit of this goes entirely to the wealthy, as it only makes financial sense for those in the highest tax brackets to invest in such bonds.
Farm Subsidies—$9 billion
The US supports 17-20% of the country’s 3.4 million farmers with subsidies designed to protect them from fluctuation in price, yields, revenue, and weather. Farmers also receive assistance with insurance, marketing, exports, and research. Such support has a long history in America, and continues to this day, despite the fact that farming is no riskier than many other industries in the US that are not protected.
Does it benefit the wealthy? Yes. The average income of all farm households was $95,418 in 2022, 27.34% higher than the average of all US households. President Trump’s 2025 “Big Beautiful Bill” will provide a $65 billion boost to these subsidies over the next ten years. As the majority of farmer subsidy money goes to the biggest farms, this increase will also benefit the wealthy.
Temporary Assistance for Needy Families Program (TANF)—$20 billion:
The federal government provides grant funds to states and territories to provide families with temporary financial assistance and related support services. State-administered programs may include child care assistance, job preparation, and work assistance, usually in the form of cash assistance. As of 2023, the Temporary Assistance for Needy Families (TANF) program provided benefits to approximately 2.8 million individual recipients in September 2023, composed of about 1.0 million families, with the majority of recipients being children (1.9 million).
Who qualifies for TANF? In order to qualify for TANF, applicants must be either pregnant or responsible for a child under 19 years of age. They must be a US national, citizen, legal alien, or permanent resident; have low or very low income; and be under-employed (working for very low wages), unemployed, or about to become unemployed. Parents who receive TANF must get a job within two years. They cannot own more than $4,250 in total assets. Participants may only receive TANF for five years within their lifetime, or less in some states.
Does it benefit the wealthy? No.
Housing Choice Voucher Program—$18.4 billion:
The Housing Choice Voucher Program provides subsidies for low-income individuals and families to rent approved units. Recipients must spend at least 30% of their income for said housing. This voucher can also sometimes be used to purchase a “modest” home.
Background: Federal tenant-based rental assistance was established as part of a major restructuring of federal housing assistance for low-income families in 1974. Since 1996, Congress has authorized HUD to award about 700,000 additional vouchers, but about half of these have simply replaced public housing or other federally subsidized housing that has been demolished, or is no longer assisted. In the past 12 years, additional HUD grants have only been made available to certain groups, such as veterans and Native Americans.
Who is eligible to participate? The Housing Choice Voucher Program has an income eligibility cap at or below median income for the area where the family wants to live. Applicants must be a citizen or eligible immigrant. Applicants cannot have been evicted from any previous public housing or Section 8 program.
How many people participate in the program?In 2023, 2.4 million families utilized this program, with a total of 5 million adults and children.
Does it benefit the wealthy? No.
Children’s Health Insurance Program (CHIP)—$23.5 billion (as of 2022)
CHIP provides health insurance for children up to 19 years of age whose families have incomes too high to qualify for Medicaid, but nonetheless can't afford private coverage. As of 2023, 33 million children were enrolled in CHIP.
Background:CHIP was passed into law in 1997. It covers hospital care, medical supplies, and tests, as well as preventive care such as eye exams, dental care, and regular check-ups.
Who is eligible? Because CHIP is financed through federal block grants that are matched by the states, coverage is determined by the states and varies somewhat. Almost every state, however, provides coverage for children in households that earn up to 200% of the federal poverty level.
Does it benefit the wealthy? No.
Low-Income Home Energy Assistance Program (LIHEAP)—$4 billion:
LIHEAP provides energy assistance and weatherization programs for low-income households. The program provides assistance with heating or cooling bills, emergency services in cases of energy crisis such as utility shutoffs, and low-cost home improvements, known as weatherization, designed to make homes more energy efficient and lower utility bills.
Background: Rising housing prices in the 1970s led to the creation of LIHEAP in 1980. The act was packaged as part of a much larger bill named the Crude Oil Windfall Profit Act. In 1984, the Human Services Reauthorization Act added a new goal to provide funds for cooling costs of low-income households.
Participants: LIHEAP is state-administered and eligibility varies.In 2023,approximately 14.5 million people participated in the program, only 20% of those eligible.
Does it benefit the wealthy? No.